

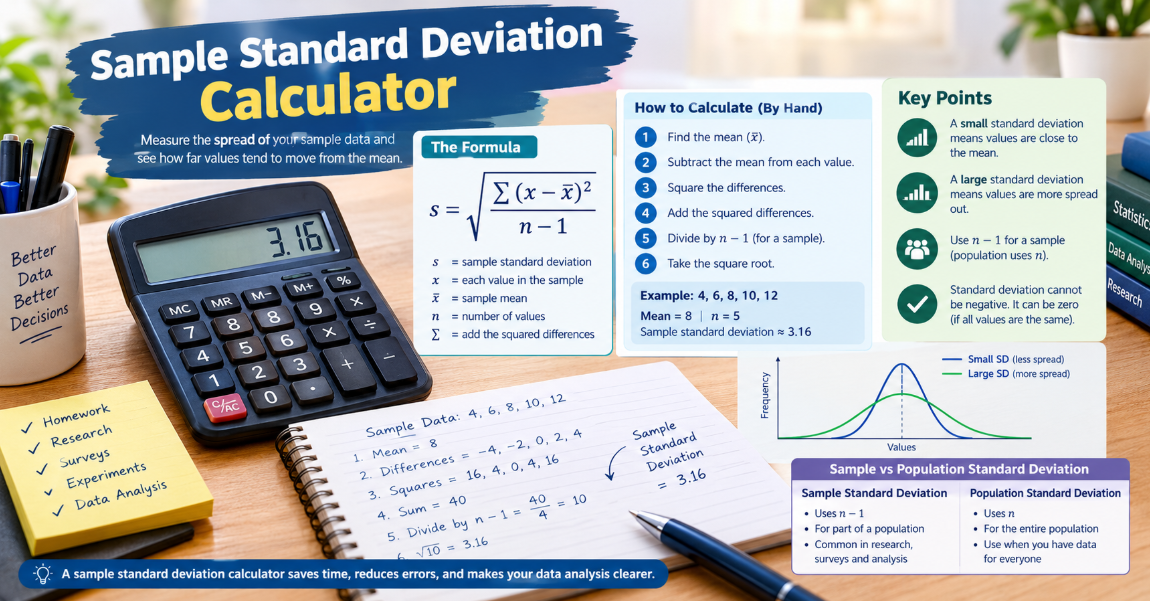
A sample standard deviation calculator helps you measure the spread of a sample. It shows how far values tend to move from the sample mean.
You can use it for statistics homework, research, surveys, experiments, and data analysis. The calculator can also save time when you have many values to check.
But what does sample standard deviation really mean? How does the formula work? And when should you use it instead of population standard deviation?
This guide explains everything in simple terms. You will also see how to calculate sample standard deviation by hand.
What Is Sample Standard Deviation?
Sample standard deviation measures the spread of values in a sample. It tells you how close or far the values are from their mean.
A small standard deviation means the values stay close to the mean. A large standard deviation means the values have more spread.
For example, imagine five students take the same test. Their scores may sit close together or vary widely. Sample standard deviation helps show how much those scores differ.
The term “sample” matters here. A sample contains only part of a larger population.
What Is a Sample Standard Deviation Calculator?
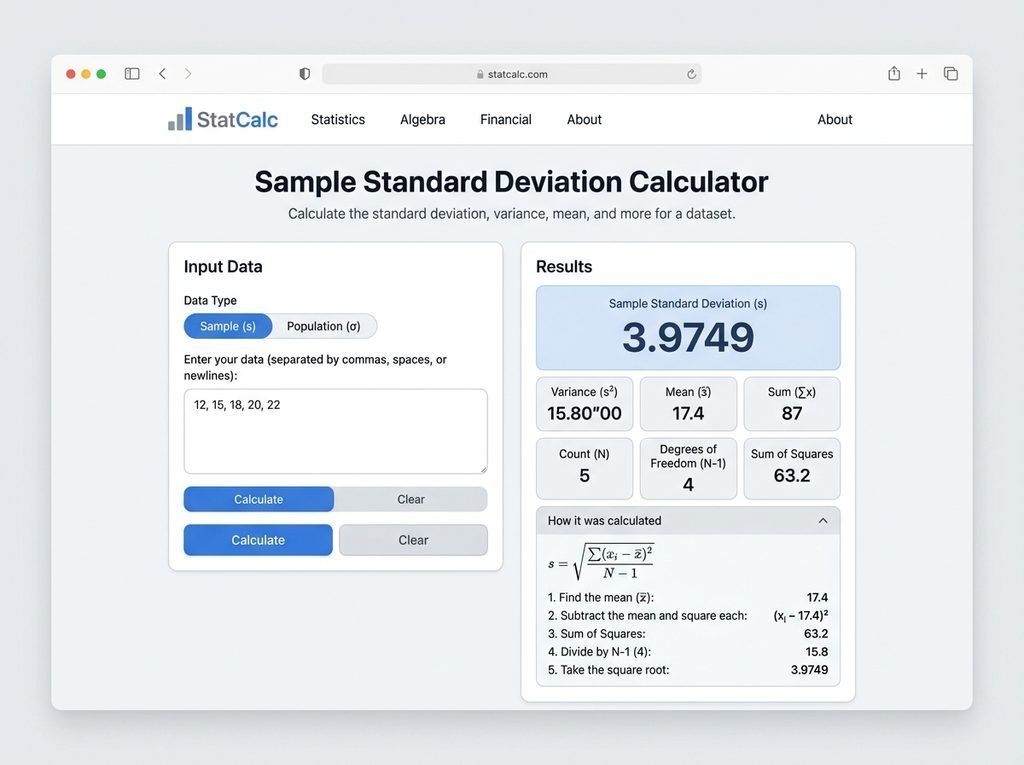
A sample standard deviation calculator works out the standard deviation for sample data. You enter your values, and the calculator performs the maths for you.
First, it finds the sample mean. Then, it finds the difference between each value and the mean.
Next, it squares those differences and adds them together. The calculator then divides the total by n − 1 and finds the square root.
This process gives you the sample standard deviation. A calculator simply completes these steps much faster.
Sample Standard Deviation Formula
The sample standard deviation formula is:
s = √[Σ(x − x̄)² / (n − 1)]
Each part of the formula has a clear meaning.
The letter s represents the sample standard deviation. The letter x represents each value in your dataset.
The symbol x̄ represents the sample mean. The letter n represents the number of values in the sample.
The symbol Σ means that you add all the squared differences together.
The most important part to remember is n − 1. Sample standard deviation uses n − 1 instead of n.
How to Calculate Sample Standard Deviation
You can calculate sample standard deviation by hand with a few simple steps.
Imagine your sample contains these five values: 4, 6, 8, 10, and 12.
First, find the mean. Add the five values together and divide the total by 5. The mean is 8.
Now subtract the mean from each value. You get −4, −2, 0, 2, and 4.
Next, square each difference. The results are 16, 4, 0, 4, and 16.
Add these numbers together. The total is 40.
There are five values, so n equals 5. Because this is a sample, divide 40 by 4. That gives you 10.
Finally, find the square root of 10. The sample standard deviation is about 3.16.
A sample standard deviation calculator can complete the same calculation in seconds.
Why Does the Formula Use n − 1?
You may wonder why the formula uses n − 1 instead of n.
The answer relates to how we estimate the mean from a sample. The sample mean can make the data look slightly less spread out than the full population.
Using n − 1 helps correct this effect. It gives a better estimate of the population’s standard deviation.
This adjustment is often called Bessel’s correction. You do not need to memorise the name to use the formula correctly.
Just remember one key rule. Use n − 1 for a sample and n for a full population.
Sample Standard Deviation vs Population Standard Deviation
Sample and population standard deviation both measure data spread. However, they apply to different types of data.
Use sample standard deviation when your data represents part of a larger population.
For example, a university may have thousands of students. If you study the test scores of 50 students, those 50 students form a sample.
Use population standard deviation when you have data for the complete population you want to study.
The main formula difference is the denominator. Sample standard deviation uses n − 1. Population standard deviation uses n.
Choosing the correct formula matters. Using the wrong one can give you a different result.
What Does Standard Deviation Tell You?
Standard deviation tells you how much the values vary around the mean.
A small result means the values sit close to the average. A larger result means the values have more variation.
For example, two groups may have the same mean score. However, their standard deviations may differ.
One group may have scores close to the mean. The other group may have scores spread across a much wider range.
Standard deviation helps you see this difference.
When Should You Use a Sample Standard Deviation Calculator?
A sample standard deviation calculator can help whenever you work with sample data.
Students can use it for statistics assignments and exam practice. Researchers can use it to study measurements and survey results.
Businesses can also use standard deviation when they analyse data. It can help them understand changes in sales, costs, performance, or other numerical values.
A calculator becomes even more useful when your dataset contains many values. Manual calculations can take time and increase the chance of mistakes.
What Is a Good Standard Deviation?
There is no single standard deviation that counts as “good” or “bad.”
The meaning depends on your data and its units. A standard deviation of 5 may be large for one dataset but small for another.
You should compare the standard deviation with the mean and the scale of the data.
For example, a standard deviation of 2 centimetres may mean something very different from a standard deviation of 2,000 pounds.
The context matters more than the number alone.
Can Standard Deviation Be Zero?
Yes. Standard deviation can equal zero.
This happens when every value in the dataset has the same value. In that case, every value sits exactly on the mean.
For example, consider the values 5, 5, 5, 5, and 5. Their mean is 5, and every difference from the mean equals zero.
Therefore, the standard deviation is also zero.
Can Standard Deviation Be Negative?
No. Standard deviation cannot have a negative value.
The formula squares each difference from the mean. Squaring removes negative signs.
The calculation then takes the square root of the result. Therefore, the final standard deviation will always be zero or positive.
If a calculator gives you a negative standard deviation, check the calculation or the calculator settings.
Common Sample Standard Deviation Mistakes
One common mistake involves using n instead of n − 1. If your data represents a sample, you should use n − 1.
Another mistake involves calculating the mean incorrectly. A wrong mean will affect every later step.
You should also avoid forgetting to square the differences. Positive and negative differences could otherwise cancel each other out.
Rounding too early can also change the final answer. Keep extra decimal places during the calculation and round the final result at the end.
How Can a Sample Standard Deviation Calculator Help?
A sample standard deviation calculator reduces the amount of manual work.
You only need to enter your sample values. The calculator can then handle the mean, differences, squared values, division, and square root.
This makes it useful for large datasets. It also gives you a quick way to check a result that you calculated by hand.
However, you should still understand the formula. Knowing the method helps you spot errors and choose the correct type of standard deviation.
Conclusion
A sample standard deviation calculator makes it easy to measure the spread of sample data. It shows how far values tend to move from the sample mean.
The sample standard deviation formula uses n − 1 in the denominator. This differs from the population standard deviation formula, which uses n.
You can calculate the result by hand, but a calculator can save time and reduce simple maths errors. Whether you study statistics, analyse research data, or work with numerical results, understanding sample standard deviation can make your analysis clearer.
FAQs
What is a sample standard deviation calculator?
A sample standard deviation calculator finds the standard deviation of sample data. It uses the sample formula and divides by n − 1.
What is the sample standard deviation formula?
The formula is s = √[Σ(x − x̄)² / (n − 1)]. It uses the sample mean and the number of values in the sample.
Why does sample standard deviation use n − 1?
Sample standard deviation uses n − 1 to give a better estimate of population variation. The adjustment helps account for the way we calculate the sample mean.
What is the difference between sample and population standard deviation?
Sample standard deviation applies to part of a population. Population standard deviation applies when your data includes the entire population you want to study.
Can I calculate sample standard deviation by hand?
Yes. Find the mean, subtract it from each value, square the differences, add them together, divide by n − 1, and find the square root.
What does a high standard deviation mean?
A high standard deviation means the values have more spread around the mean. You should always consider the size and units of the dataset.
For more updates visit: CALCIQ