


Table of Contents
- How to Use the Average Percentage Calculator
- How to Average Percentages Step by Step
- Average Percentage Examples
- When You Need a Weighted Average Instead
- Common Mistakes When Averaging Percentages
- FAQs
Percentages turn up everywhere — test scores, survey results, discount rates, pass rates — and sooner or later most people need to combine several of them into one average figure. The basic method takes seconds: add the percentages together and divide by how many there are. The catch is that this simple average is only correct when every percentage is based on the same size of group or amount. When the groups behind the percentages are different sizes, you need a weighted average instead, and this guide shows how to spot the difference. For a quick answer, use the average percentage calculator at the top of this page: type in your percentages, add rows as needed, and the average appears right away. Finally, if your percentages come from groups of different sizes, enter each group’s size as a weight and the tool shows the weighted average alongside the simple one.
Average Percentage Calculator
Add each percentage below. Add a base / weight only if the percentages come from different-sized groups.
Average percentage:
Number of values:
Sum of percentages:
How to Use the Average Percentage Calculator
The average percentage calculator at the top of this page starts with three empty rows, and you can add more — up to twenty — with the “Add another percentage” button. First, each row has two boxes. The first is the percentage itself. The second, marked optional, is the base or weight: the size of the group or amount that the percentage came from, such as the number of students in a class or the number of questions on a test. Leave the weight boxes empty if you only need the simple average.
Every row also has a Remove button, and you can keep as few as one row. Press Calculate and the average percentage calculator shows how many percentages you entered, their sum, and the average percentage to two decimal places. The result updates as you type. In addition, if at least two rows have a weight filled in, a weighted average appears too, clearly labelled and calculated only from the rows that have weights. Blank or invalid entries produce a friendly message asking you to check the numbers. Enter percentages as plain numbers — type 80 for 80%, without the percent sign — and if you use weights for some rows, add them for all of them where you can.
How to Average Percentages Step by Step
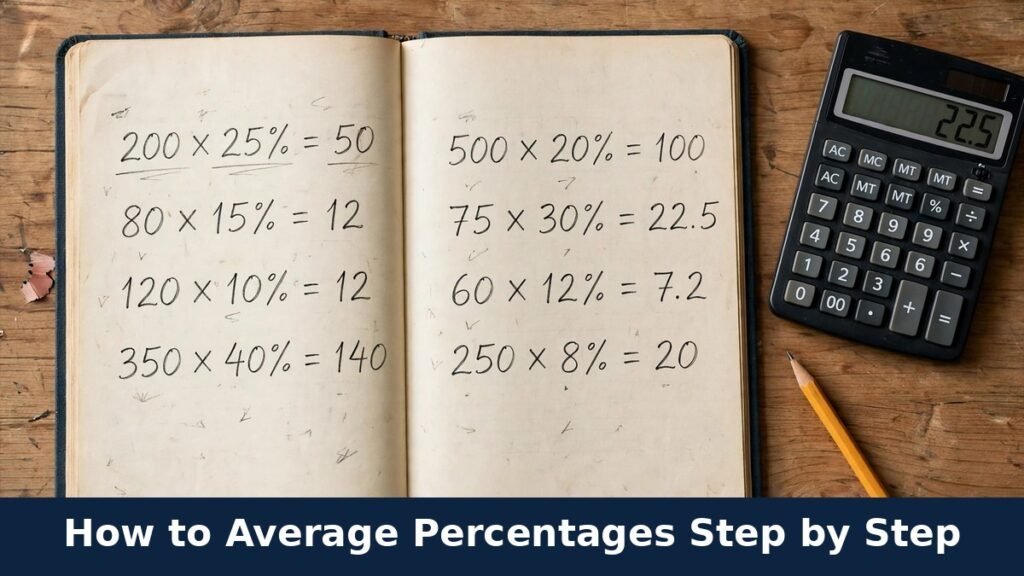
The simple average of percentages is the ordinary mean, applied to percentage values. If the idea of a mean is new to you, our average calculator covers the general method, and this page applies it to percentages specifically. The steps are:
- First, write down all the percentages you want to combine.
- Then, add them together to get the sum.
- Next, count how many percentages there are.
- Then, divide the sum by the count.
- Finally, round the answer to two decimal places and add the percent sign.
In formula form:
Average percentage = (sum of the percentages) ÷ (number of percentages)
Here is a short example. A student scores 80%, 90% and 100% on three quizzes of equal length. The sum is 80 + 90 + 100 = 270. There are three percentages, so the average is 270 ÷ 3 = 90.00%. Nothing more is needed, because each quiz counted the same number of questions towards the result. The same three-step logic — add, count, divide — works for survey responses, monthly growth figures or any other set of percentages that share an equal base.
| Step | Action | Example values |
|---|---|---|
| 1 | List the percentages | 80%, 90%, 100% |
| 2 | Add them together | 80 + 90 + 100 = 270 |
| 3 | Count the percentages | 3 |
| 4 | Divide sum by count | 270 ÷ 3 = 90 |
| 5 | Write as a percentage | 90.00% |
Average Percentage Examples
Examples with slightly less tidy numbers show why rounding at the end matters. Suppose three branches of a shop report customer satisfaction of 45.5%, 62.25% and 78%. The sum is 45.5 + 62.25 + 78 = 185.75, and dividing by 3 gives 61.9166…, which rounds to 61.92%. Rounding each value first would have nudged the answer, so keep full precision until the last step — or let the calculator at the top of this page handle it.
| Percentages | Sum | Count | Average percentage |
|---|---|---|---|
| 80, 90, 100 | 270 | 3 | 90.00% |
| 45.5, 62.25, 78 | 185.75 | 3 | 61.92% |
| 70, 75 | 145 | 2 | 72.50% |
| 60, 65, 70, 75, 80 | 350 | 5 | 70.00% |
One more everyday case: averaging exam grades across a term. If four equally weighted tests come back at 72%, 84%, 68% and 88%, the sum is 312 and the average is 312 ÷ 4 = 78.00%. Teachers use exactly this method when every test carries the same weight in the final grade. As soon as one test counts for more than the others — a final exam worth half the course, for instance — the simple method stops being the right tool, which brings us to weighted averages. If you also need to compare two of the percentages directly, the percentage difference calculator shows how far apart they are.
When You Need a Weighted Average Instead

This is the part most guides skip, and it is where averaging percentages goes wrong in real life. A simple average treats every percentage as equally important. That is fair only when each percentage is based on the same amount. For example, when the bases differ — one percentage describes 10 people and another describes 500 — the bigger group should influence the combined figure more, because it contains more of the underlying cases.
The fix is the weighted average:
Weighted average % = total of (percentage × its base amount) ÷ total base amount
There is an equivalent way to think about it that many people find clearer: work out the actual value behind each percentage, add those actual values, divide by the total base, and multiply by 100. In other words, combined percentage = total actual value ÷ total base × 100. Both routes give the same answer, because they are the same calculation arranged differently. Wolfram MathWorld’s page on the weighted mean sets out the general formula, and Khan Academy’s review of the mean is a good refresher on the ordinary mean behind the simple average.
Worked Example: Two Classes
Now the example that shows why this matters. Two classes take the same test:
- Class A: 80% of 10 students passed. That is 0.80 × 10 = 8 students.
- Class B: 90% of 50 students passed. That is 0.90 × 50 = 45 students.
The simple average of 80% and 90% is 85%. But look at the real numbers: 8 + 45 = 53 students passed out of 10 + 50 = 60 students in total. The true combined pass rate is 53 ÷ 60 × 100 = 88.33% — not 85%. The simple average understates the result because it gives the tiny class of 10 the same influence as the class of 50, even though five times as many students sit behind the 90% figure.
| Class | Pass rate | Students | Students who passed |
|---|---|---|---|
| Class A | 80% | 10 | 8 |
| Class B | 90% | 50 | 45 |
| Combined (weighted) | 88.33% | 60 | 53 |
| Simple average (incorrect here) | 85.00% | — | — |
Use the weighted method whenever you combine pass rates across classes of different sizes, conversion rates across campaigns with different traffic, or scores across tests with different numbers of questions. If you are unsure how a percentage was produced in the first place, our guide on how to calculate percentage walks through finding the base and the actual value. And for what a percentage means at the most basic level, Wolfram MathWorld’s percent page is a reliable reference.
Common Mistakes When Averaging Percentages
The first mistake is the one covered above: averaging percentages from groups of different sizes and reporting the simple mean as if it were the overall rate. It is probably the most common percentage error in reports, dashboards and news stories alike. Similarly, the second is averaging percentages that were never meant to be combined — for example, adding a pass rate, a satisfaction score and a discount rate together just because they are all percentages. Averages only make sense when the values measure the same kind of thing.
Third, watch out for percentage points versus percent: a rise from 40% to 50% is an increase of 10 percentage points, and averaging percentage changes needs care about what each change was measured from. Finally, do not average rounded figures when the originals are available. Enter the full values into the calculator at the top of this page and let it round once, at the end.
FAQs
How do you find the average of percentages?
Add all the percentages together and divide by how many there are. For example, for 80%, 90% and 100%, the sum is 270 and the count is 3, so the average is 90.00%. This simple average — sometimes searched for with an average percent calculator — is correct when each percentage is based on the same size of group or amount.
When is a simple average of percentages wrong?
It is wrong when the percentages are based on different-sized groups or amounts. For example, 80% of 10 students and 90% of 50 students combine to a pass rate of 88.33%, not the simple average of 85%. As a result, use a weighted average so the larger group counts for more.
How do you calculate a weighted average percentage?
Multiply each percentage by its base amount, add those products together, and divide by the total of the base amounts. Equivalently, add up the actual values behind the percentages, divide by the total base, and multiply by 100. Finally, the average percentage calculator on this page shows the weighted average automatically when at least two rows have a weight entered.
Can you average percentages from different totals?
Not with the simple method. If the totals differ, convert each percentage back to its actual value first — for example, 80% of 10 students is 8 students — then add the actual values and the totals separately and divide. Therefore, that is exactly what a weighted average does for you.
How many percentages can the calculator average at once?
You can enter up to twenty percentages, adding rows with the “Add another percentage” button and removing any you do not need. In addition, the average percentage calculator reports the count, the sum and the average, and it recalculates as you type so you can adjust values and see the effect immediately.
Should percentages be rounded before averaging?
No. Keep each percentage at full precision while you add and divide, and round only the final answer — this page shows results to two decimal places. In addition, rounding the inputs first can shift the average, especially with values like 62.25% that carry useful detail beyond the decimal point.
For more updates visit: CALCIQ


